
AI Based All-in-one Observability and Monitoring Platform

Nusametric is an AI-based all-in-one observability and monitoring platform by Sinux (PT STRATEGI INTEGRASI NUSANTARA) designed to help organizations delivers end-to-end visibility across applications, infrastructure, and telemetry bringing critical signals into a single pane of glass. By correlating metrics, logs, traces, and real-time events, teams can detect anomalies earlier, reduce troubleshooting time, and report service health with executive ready clarity and SLA alignment.

Realtime
Data-streaming
4 Signals
Metrics, Logs, Traces, Exemplars
OTLP
OpenTelemetry Protocol
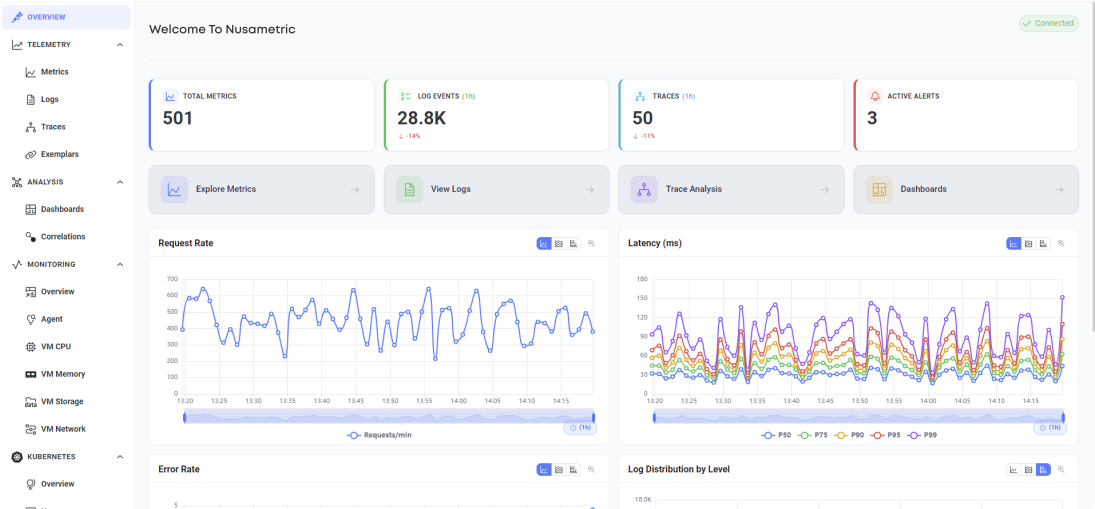
Comprehensive Observability Features

Metrics Explorer
Query and visualize time-series metrics with interactive charts. Multiple chart types, zoom & pan, and synchronized views.

Log Viewer
Real-time log streaming with advanced filtering and search capabilities. Correlate logs with traces for complete context.

Distributed Tracing
Visualize request flows across services with waterfall, flame graph, and node graph views for deep performance analysis.

Exemplars
Link metrics to traces for context-aware debugging. Jump from metric spikes directly to related traces.

Dashboard Builder
Create custom dashboards with drag-and-drop widgets. Build the perfect view for your team's needs.

Alert Management
Configure alert rules with thresholds and conditions. Track alert history and manage severity levels.

Correlation Engine
Cross-signal correlation for root cause analysis. Unified timeline view of all telemetry signals.

Kubernetes Monitoring
Monitor Kubernetes clusters with detailed views of nodes, pods, deployments, and persistent volumes.
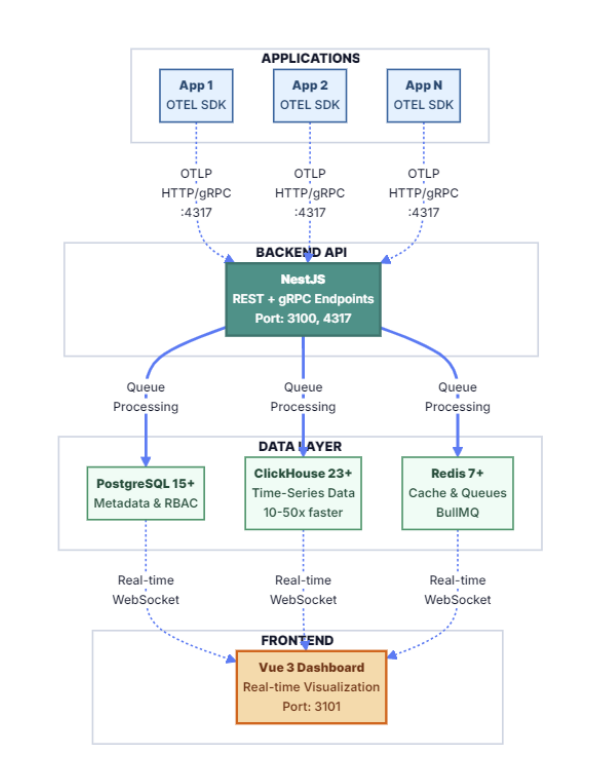
Modern Architecture
Built with cutting-edge technologies for performance and scalability
Vue 3.5
Progressive Framework
Typescript
Type Safety
NestJS 10
Backend Framework
ClickHouse
Time-Series DB
PostgreSQL
Relational DB
Redis
Cache & Queue
ECharts 6
80+ Chart Types
BullMQ
Job Processing
NATS
Event Streaming
Documentation & Resources
Everything you need to get started with Nusametric


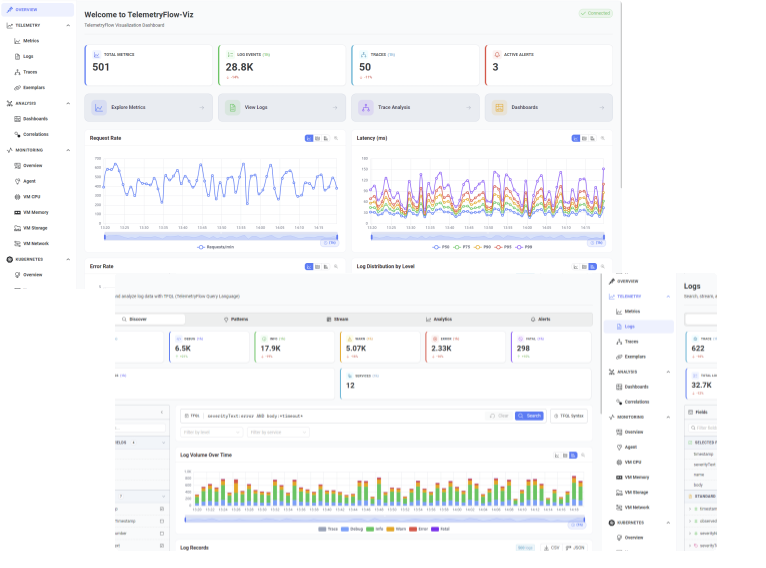
Try Nusametric Now
Experience the power of modern observability with our live demo dashboard. Explore metrics, logs, traces, and more with interactive visualizations.
Demo Account
Try
Screenshot
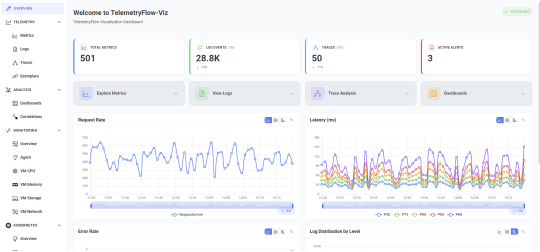
Dashboard Overview
Real-time metrics, service health status, and key performance indicators at a glance
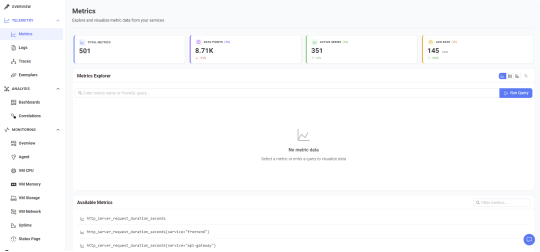
Metrics Explorer
Query and visualize time-series metrics with interactive charts and multiple visualization types
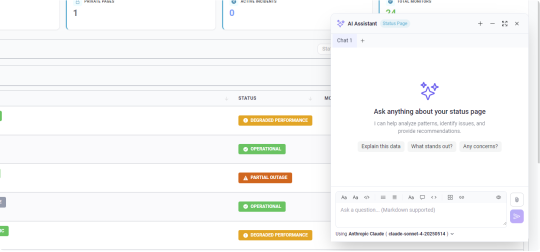
AI Assistant (Bring Your Own LLM)
Built-in AI-powered chatbot for natural language queries about your telemetry data, troubleshooting guidance, and intelligent insights
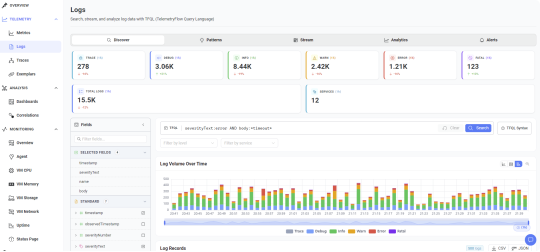
Centralized Log Viewer
Real-time log streaming with advanced filtering, search, and severity-based categorization
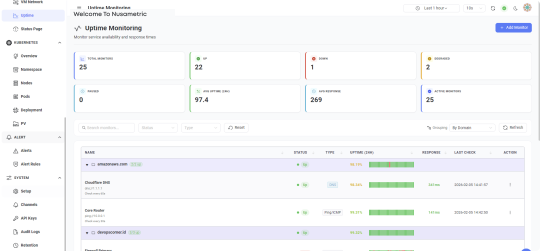
Uptime Monitoring
Monitor service availability with HTTP, TCP, and ICMP checks, response time tracking, and uptime percentage calculations
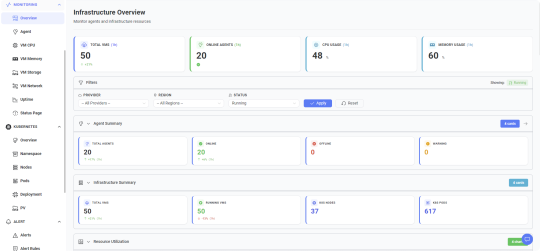
Infrastructure Overview
Real-time metrics, service health status, and key performance indicators for all of your assets
Sinux Certification



















Sinux Portfolio

























 STRATEGI INTEGRASI NUSANTARA